Watchdog — a monitoring system we had to be right about.
PRTG-class infrastructure monitoring in Node and strict TypeScript. Probes run checks against your devices; the core stores the results, decides state and notifies. Production is a native service with PostgreSQL as its only always-on dependency — no container, no broker, no cluster.
The problem
A monitoring system is judged entirely on the times it is wrong. A false alarm costs trust; a missed outage costs the customer. Everything below follows from refusing both — which mostly means being paranoid about what happens when a component of the monitoring system itself goes down.
Architecture
Two services. ms-core owns the API, storage, notifications, maps, reports and the probe endpoint. ms-probe owns the scheduler, check execution and the protocol listeners. They speak over a mutual-TLS wire protocol, and a probe can sit on a remote network with only outbound access.
Results are written to a disk spool before anything else touches them and drained as the core acknowledges them. Kill the core mid-run and nothing is lost; restart the probe and the queue is still there. The core also serves the built web UI itself — in production there is no second process to keep alive.
The spool is the reason an outage in the monitoring system is not also a hole in its own history.
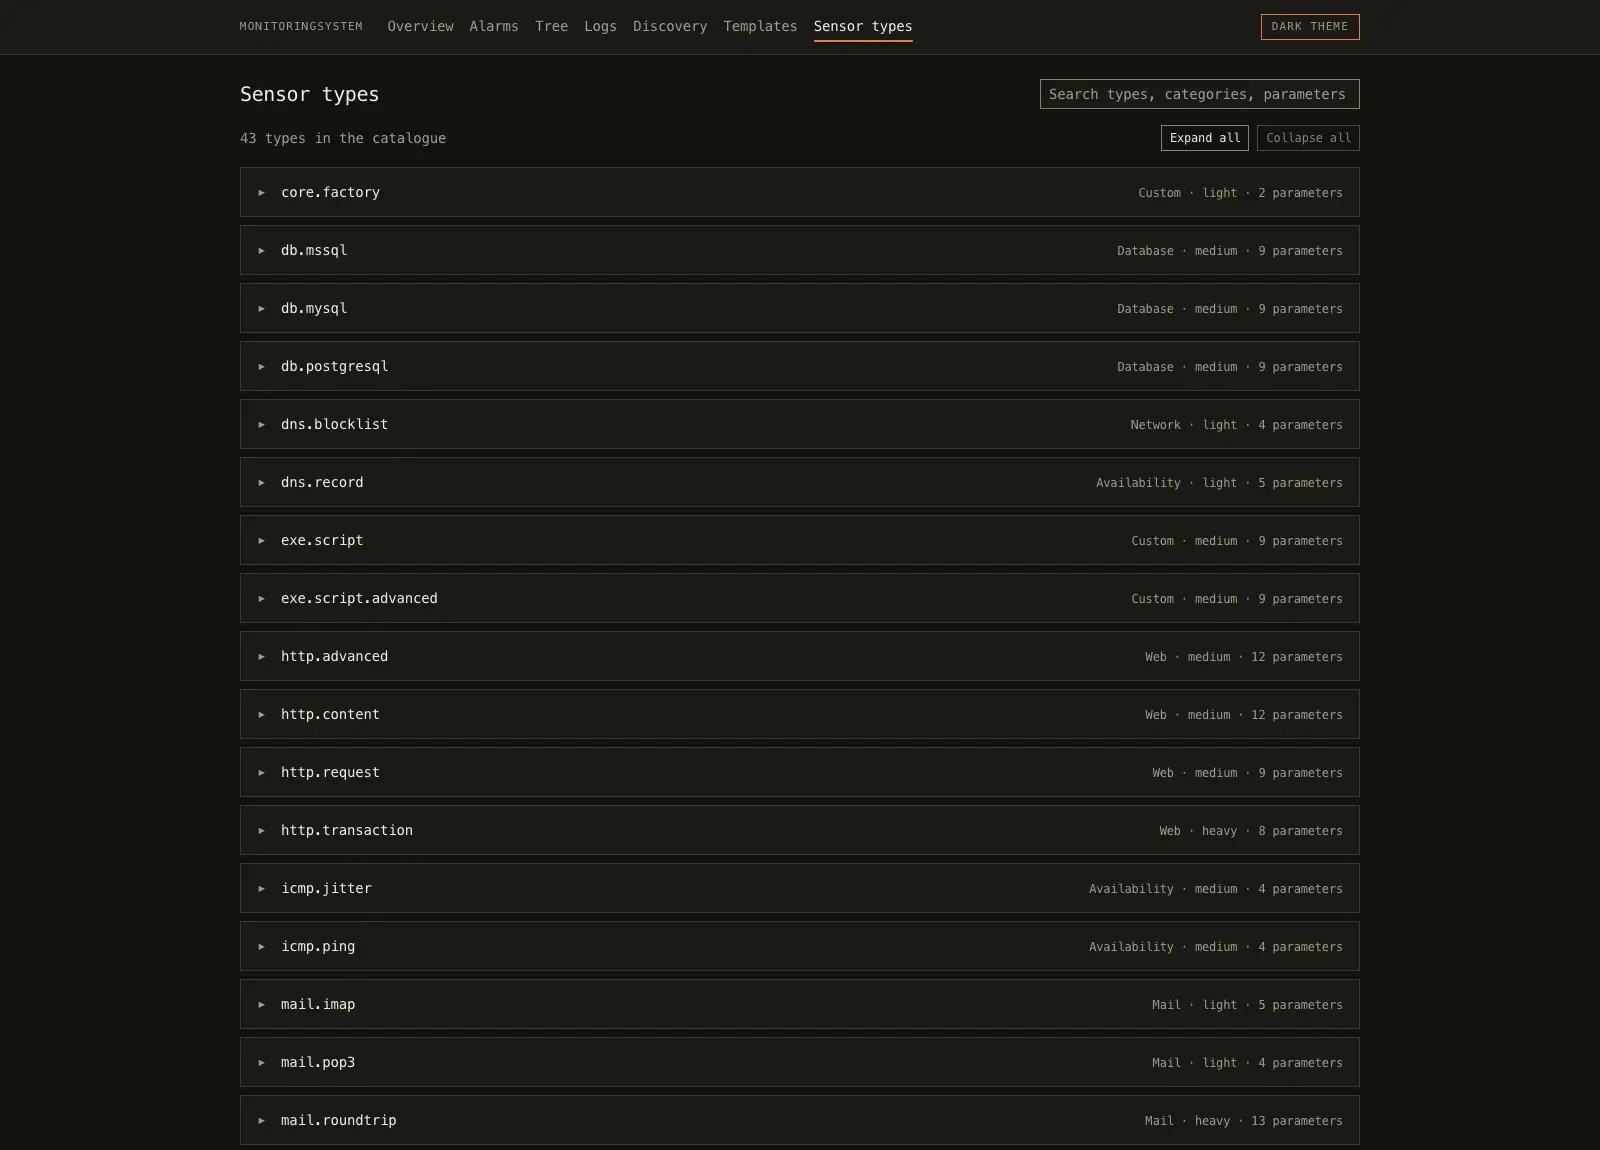
Device tree & state
Stylised UI, then the real oneOnly the object that was paused can be resumed.
Two consecutive failures move Up → Warning → Down, and recovery goes straight back to Up. How many warnings come first is an inheritable setting, so a group can set it for everything beneath it. Zero means immediate-down.
Every transition is appended with what it changed from, why, and the probe's own message.
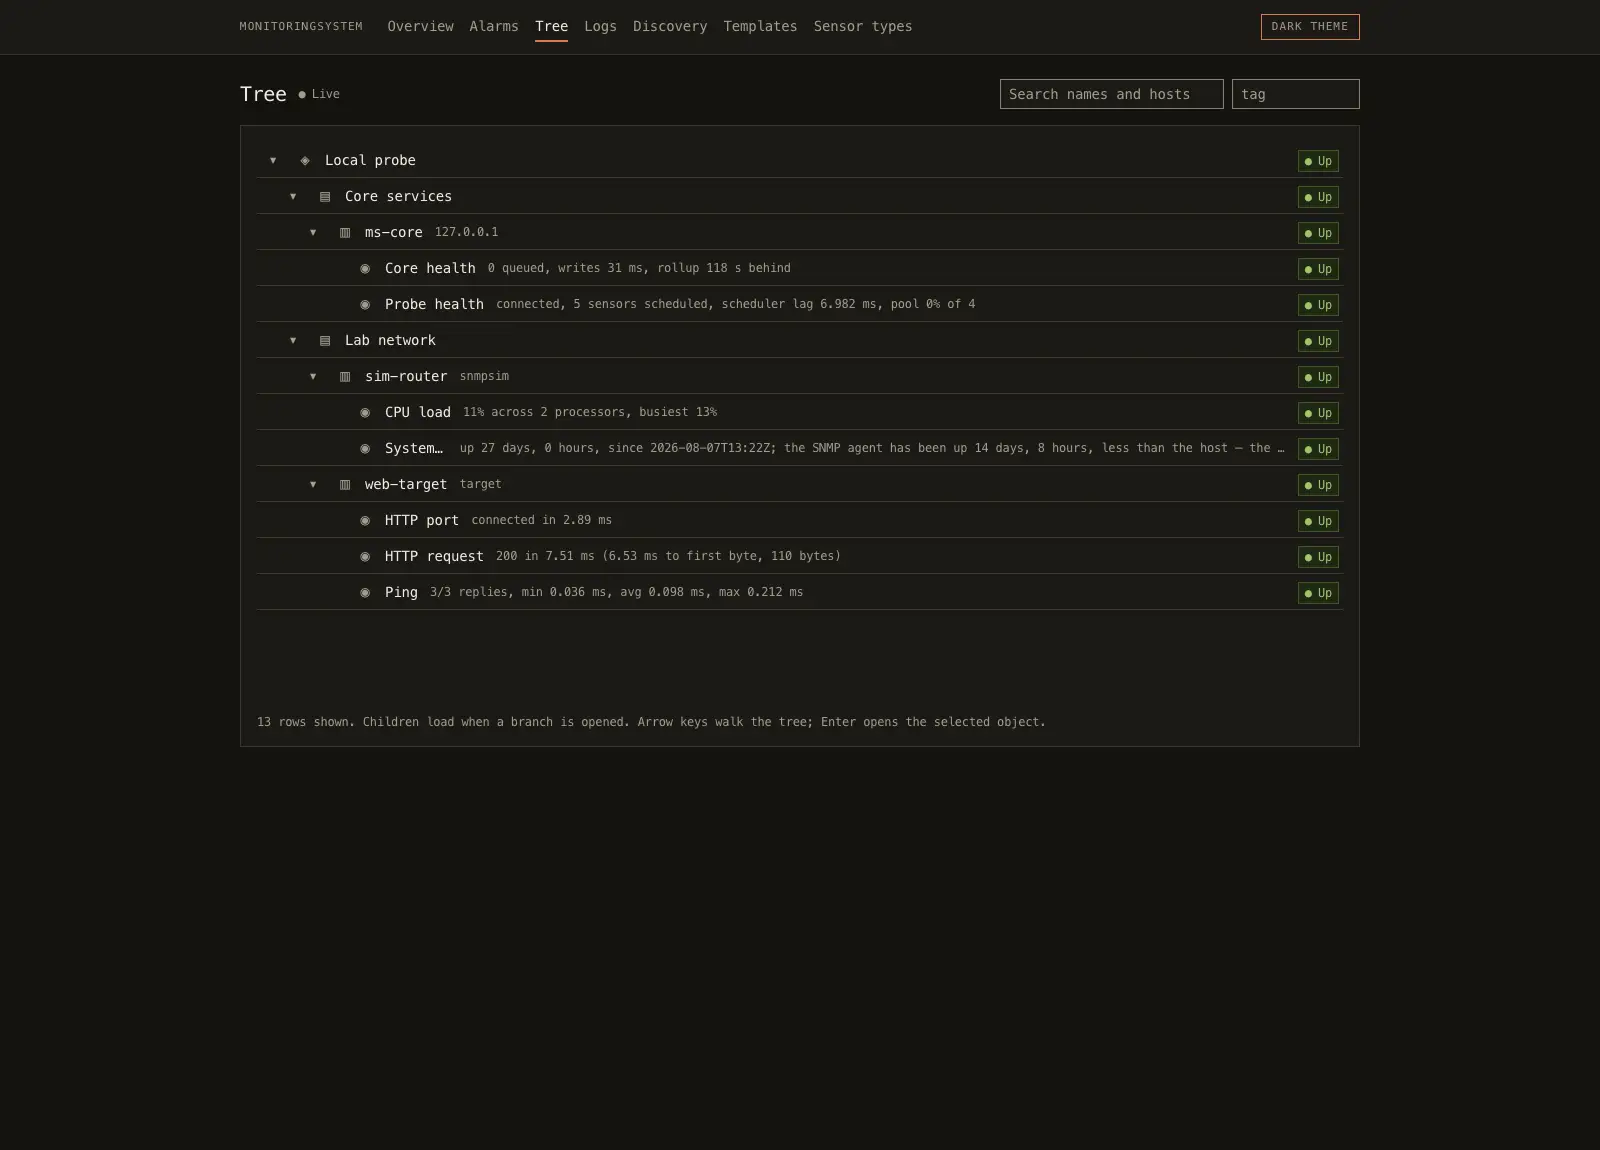
Channels, limits & the gap
A reading is scaled by its channel's factors and passed through a spike filter before anything judges it — bytes become bits, centidegrees become degrees, and a wrapped counter is discarded rather than flattening the graph. The scaled value is what gets stored, judged and drawn. One number, so the chart can never disagree with the alarm.
readings
Judged on the scaled reading itself, never a smoothed one — a disk 99 % full is 99 % full. How many warnings come before a Down is the state machine's business, above. Editing one takes effect on the next scan, not the next restart.
A channel reporting a status code rather than a measurement is judged by a lookup: 2 becomes "down", 1 becomes "up". Operators ship their own.
A discarded reading leaves a gap, not a zero — and decides nothing. It cannot trigger an alarm or clear one.
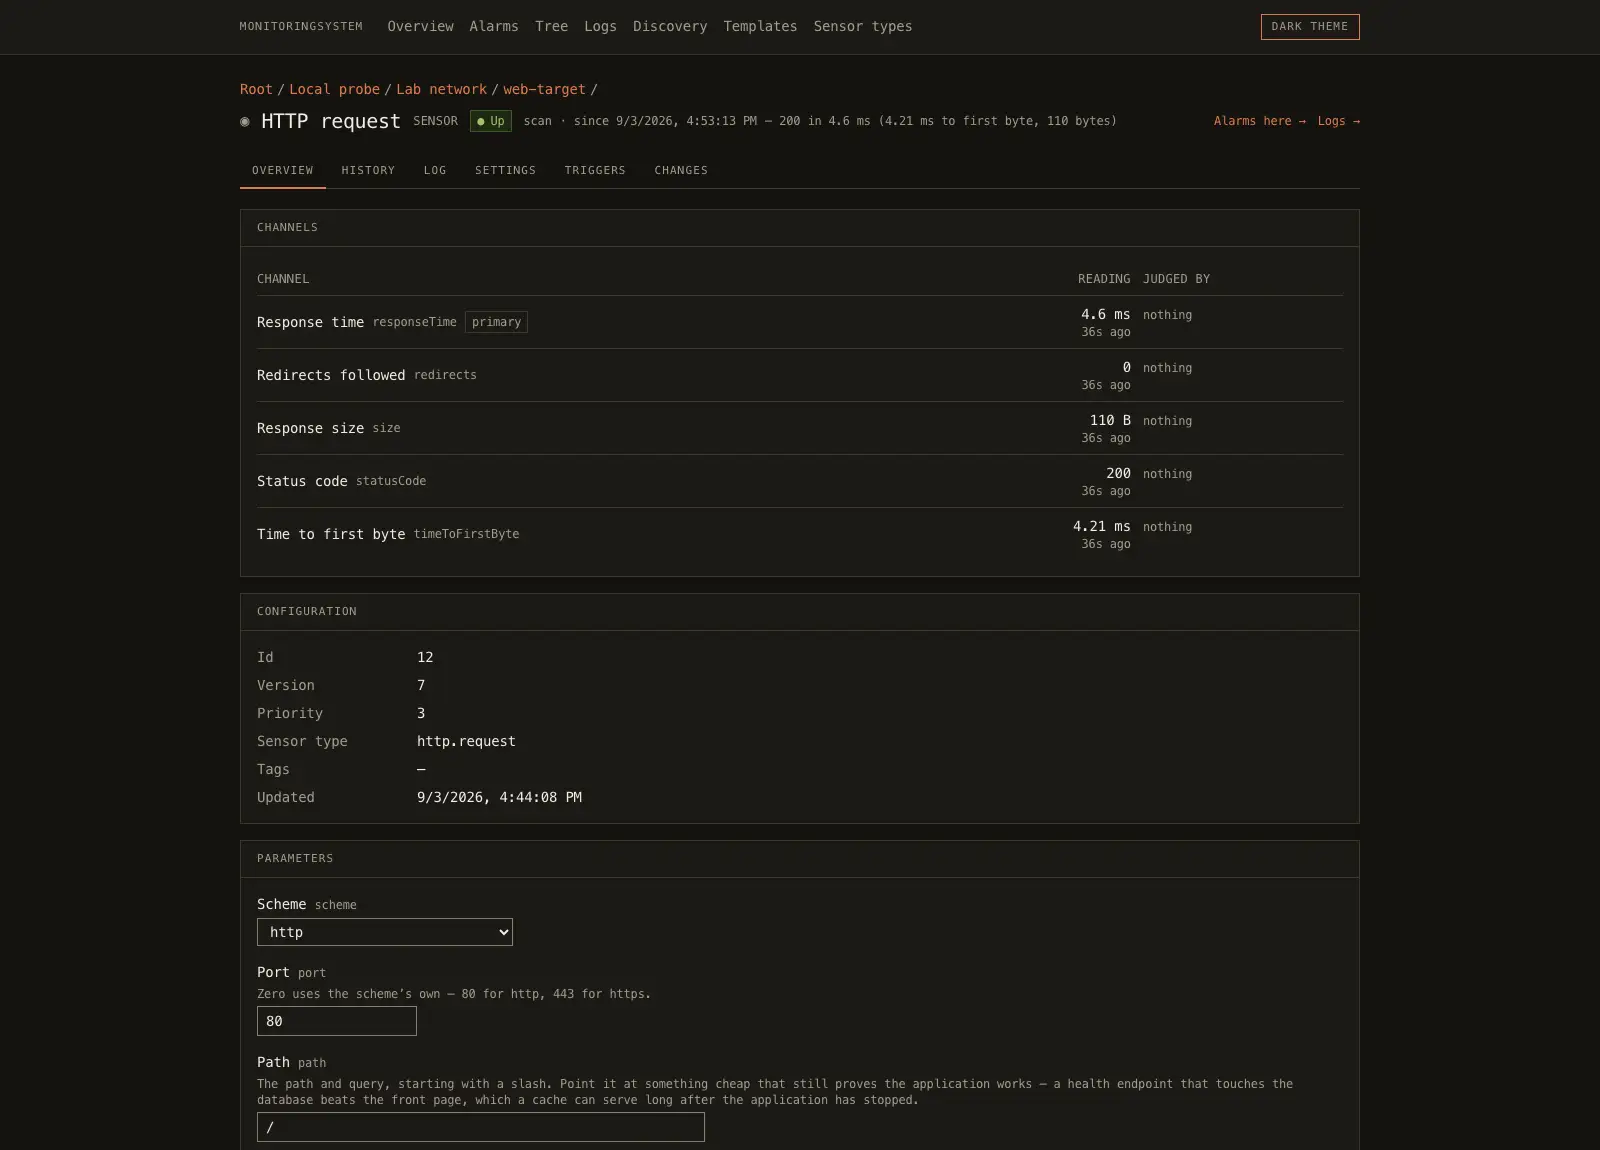
Storage — the licence decision
We depend on the TimescaleDB Community licence for exactly one feature: native compression, worth about ten times on disk with no Apache-licensed substitute. Everything above it — the rollup tiers, the retention policy, the loop that drives them — we wrote ourselves, so nothing else is tied to the engine.
To keep that honest, the database can be started under the Apache-only feature set on demand. Any new dependency on a licensed feature then fails immediately, and the migration that needs it refuses to apply at all — with a message saying why.
→ migration 004 refuses, states the reason
Flow, maps & reports
A device that answers every ping can still be the one saturating the line, so the probe now listens for flow records — NetFlow v5 and v9, IPFIX, sFlow — and decodes them itself. They arrive as one more sensor type, judged by the same limits and the same state machine as everything else.
Above that sit two things every monitoring system is eventually asked for. Maps: a designer with snapping and undo, live graphs on the canvas, a background image or a geographic tile source you point at yourself, and a share link for a screen nobody signs in to. Reports: scheduled, run as a named user so they can only contain what that user may see, and delivered as HTML, CSV, XML or PDF.
→ no headless browser, fonts embedded, CJK renders
Status
Honest versionanyNo console.log in packagesJSON Schema at every boundaryErrors carry contextSmoke install on every commitNeed systems software, not a dashboard?
Schedulers, agents, time-series at scale, native installs. This is the kind of work we take on.